Texas Lightning: When, Where and How Often It Strikes
By Site Safe Lightning Protection 9 min read
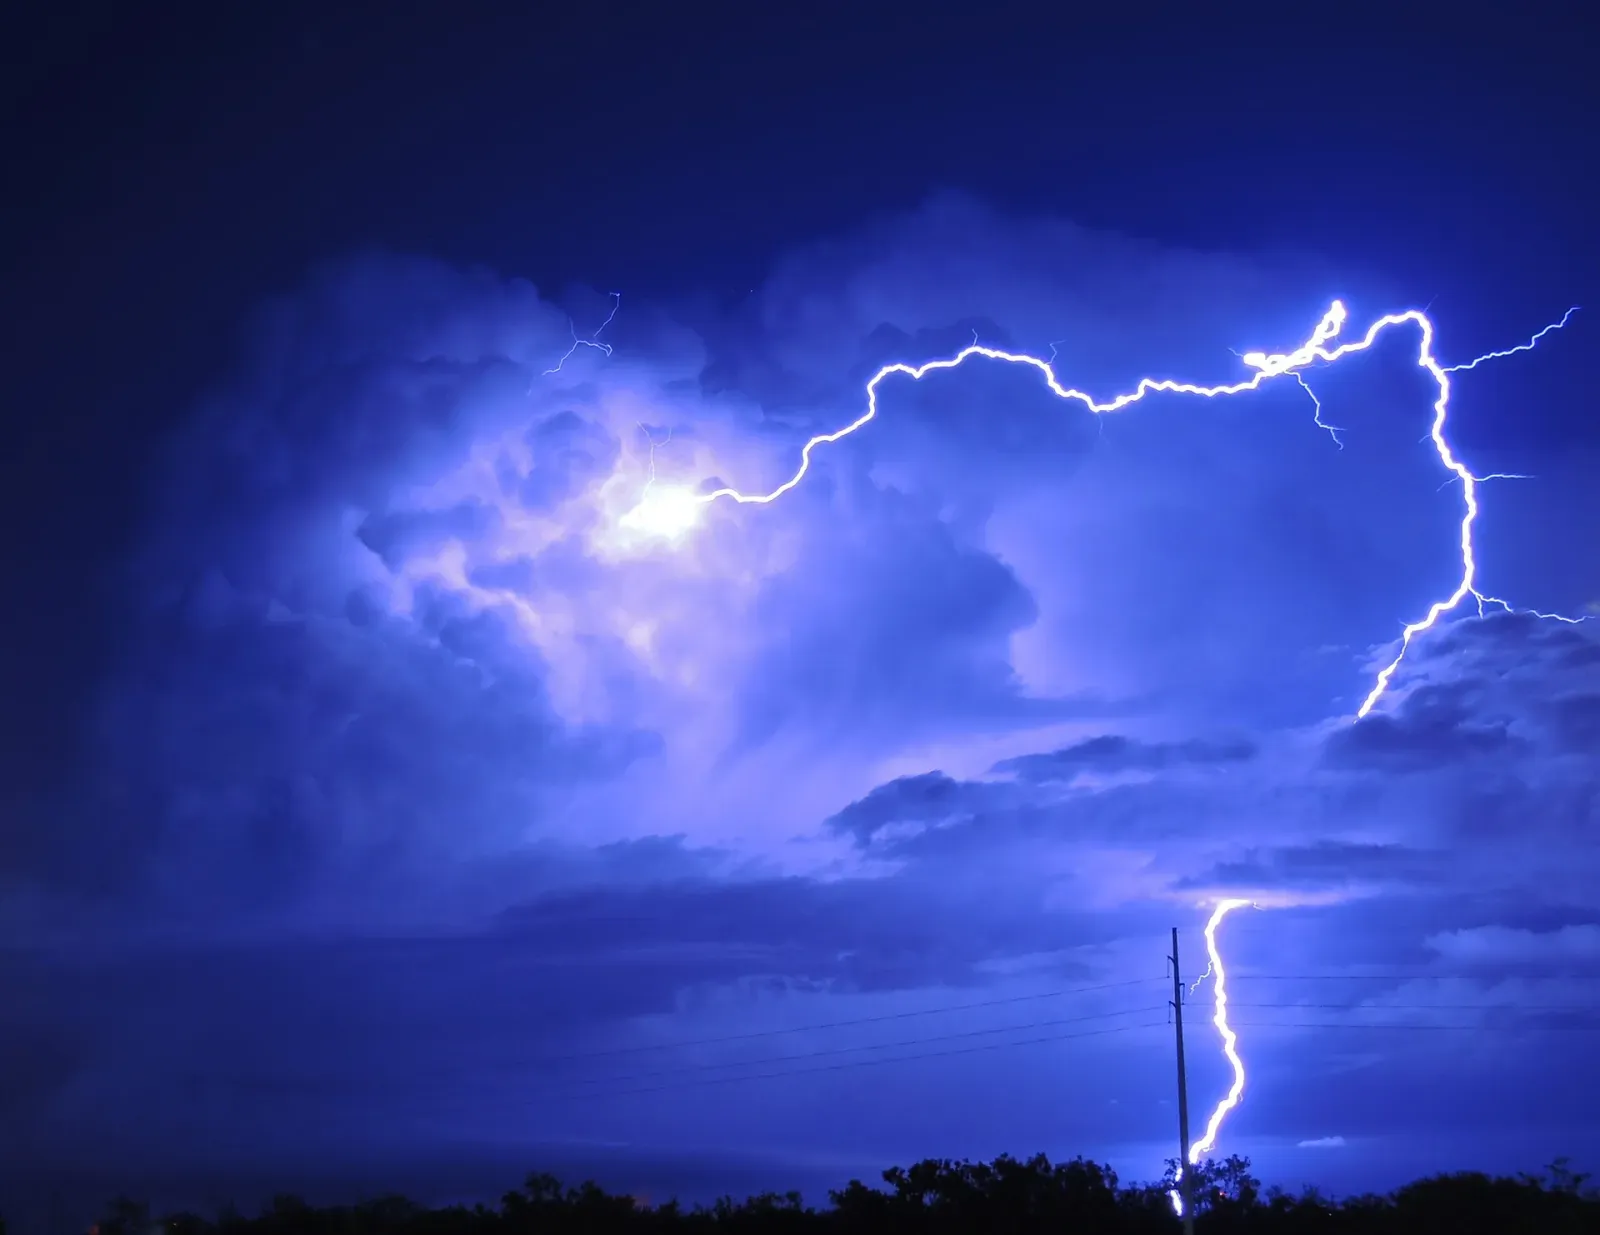
Texas gets more lightning than any other state. Vaisala’s detection network counted 47 million lightning events in Texas in 2025, the most in the country (Vaisala). Summer is the peak, spring is close behind, and the upper Texas coast and East and North Central Texas take the most strikes per square mile. West Texas gets fewer, but the strikes it does get land on open country where a tank battery or a barn is often the tallest thing around.
This article covers Texas lightning season month by month, flash density by region, what the numbers mean for Dallas-Fort Worth and the Permian Basin, and what they mean for homes, commercial buildings and oil and gas sites.
Texas lightning by the numbers
| Measure | Figure | Source |
|---|---|---|
| Total lightning, 2025 | 47 million events, most of any state | Vaisala |
| Total flashes, 2025 | More than 13 million, 1.3 million above the state’s average | AEM |
| Dangerous Thunderstorm Alerts, 2025 | 9,103, more than twice the next state (Oklahoma) | AEM |
| Busiest Texas lightning day, 2025 | May 26 | AEM |
| Lightning deaths, 2006 to 2024 | Top two in the US with Florida; Colorado is 3rd | NWS Pueblo |
| Homeowners lightning claims, 2025 | 4,188 claims, 3rd in the US; average claim $60,382, the highest of the top ten states | III |
Vaisala counts lightning “events” and AEM counts “flashes”, so the two totals aren’t comparable with each other. Both reports agree on the ranking. Texas leads on volume because it is so large. Vaisala notes that once you adjust for area, Texas drops out of the top five states for density. Florida and Oklahoma lead on that measure (see the US lightning capital).
When is lightning season in Texas?
Summer is the peak of the Texas lightning season, followed by spring. That’s the finding of a 1995 to 2019 Texas climatology produced at NOAA’s National Severe Storms Laboratory, which attributes the summer maximum to convective storms (NSSL/SCIPP). Lightning in Texas doesn’t stop in winter, though. Monthly maps built by Vaisala scientists from the National Lightning Detection Network (2004 to 2008) show Texas keeping lightning activity in months when most of the country has very little (Holle and Cummins).
| Month | What the data shows for Texas |
|---|---|
| December to February | The quietest months. NSSL’s winter map is near zero across most of the state. Vaisala’s January map still shows a moderate maximum in Texas east of Dallas-Fort Worth. |
| March | Storm season starts. A few small areas in Texas pass 1.0 on the NLDN March map, which is scaled in flashes per km² per year. |
| April | Activity spreads. The busiest single day for US lightning in 2025 was April 5, weeks ahead of the usual season (Vaisala). |
| May | The highest rates on the NLDN May map, above 2.0, run from Texas northeast into Kentucky. Texas had its busiest lightning day of 2025 on May 26 (AEM). |
| June to August | The peak. Two-thirds of US cloud-to-ground flashes happen in these three months. NSSL’s summer map is the brightest of the four seasons, with the maximum around Houston. |
| September | A marked drop across the whole US on the NLDN map. |
| October and November | Texas stays active. In October the higher densities are scattered across the southern Great Plains and Texas. In November, the only maxima in the country are in Texas and Louisiana. |
Sources: NSSL/SCIPP, Holle and Cummins, Vaisala 2025, AEM 2025.
For property owners, the practical window is clear. Have inspections, repairs and new installs done by March, before spring storms start in North Texas.
Where Texas gets the most lightning: flash density by region
Flash density is the number of cloud-to-ground strikes per square kilometer per year. It is the number a lightning risk assessment starts from, and it varies several-fold across Texas.
NSSL’s annual Texas map (1995 to 2019) shows the pattern clearly (NSSL/SCIPP). The figures below are read off the map’s color scale, so treat them as approximate:
| Region | Approximate annual density (strikes/km²) | Season that drives it |
|---|---|---|
| Upper Texas coast, Houston area | About 9 to 10, the state’s highest | Summer, by a wide margin |
| East Texas and North Central Texas, including DFW | About 6 to 8 | Spring and summer |
| Central and South Texas | About 4 to 5 | Spring and summer |
| Panhandle and West Texas, including the Permian Basin | About 3 to 5 | Mostly summer |
| Far West Texas (El Paso, Trans-Pecos) | About 2 to 3, the state’s lowest | Summer |
The national picture explains the gradient. Vaisala’s NLDN analysis finds the highest densities in Florida and along the Gulf Coast, where warm water supplies deep moisture, and a general decrease from east to west across the country (Holle and Cummins). Texas spans both ends of that gradient.
For a design or a formal risk assessment, use site-specific data rather than a statewide map. Our lightning risk assessment guide shows how flash density feeds the NFPA 780 calculation.
Dallas-Fort Worth and North Texas
North Texas gets lightning in two seasons. On NSSL’s spring map, the brightest part of the state sits over North and Northeast Texas, east of the Metroplex. Summer adds a second round. AEM recorded 17,754 lightning flashes at Dallas-Fort Worth International Airport in 2025, with the airport’s busiest day on August 4 (1,410 flashes). That put DFW among the top five of the ten busiest US airports for lightning (AEM).
Two things follow for DFW buildings. First, the season starts earlier than many owners expect, so March is the time to check a system. Second, the winter maximum east of DFW on the NLDN January map means a mild-weather storm in December or January isn’t unusual. Our Dallas–Fort Worth lightning protection page covers homes and commercial buildings in the Metroplex.
The Permian Basin and West Texas
West Texas has lower flash density than the east of the state, and most of its lightning comes in summer. On NSSL’s spring map, West Texas is among the darkest parts of the state. On the summer map it picks up noticeably, with patches in the Panhandle and West Texas brighter than much of Central Texas (NSSL/SCIPP).
Lower density doesn’t mean low exposure for an operator. The risk adds up across sites. NFPA 780’s simplified risk method estimates direct strikes a year as flash density × collection area × a location factor (our risk assessment guide). Here’s a rough worked example for a single tank battery:
- A line of tanks and vessels about 30 m long, 10 m wide and 6 m tall has a collection area of about 2,760 m².
- At a flash density of 4 and a location factor of 1 (isolated, nothing taller nearby), that’s about 0.011 direct strikes a year, or one every 90 years or so for that site.
- An operator with 300 similar sites should expect about three direct strikes a year somewhere in its field.
Those are direct strikes only. Nearby strikes also send surges into instrument wiring, automation and power lines.
What it means for homes
A Texas home faces the same failure points as a home anywhere: the chimney, the ridge, a tall tree beside the house, and surges coming in on power, cable and phone lines. The differences in Texas are the number of storms and how much each claim costs. Texas homeowners’ lightning claims averaged $60,382 in 2025, the highest of the top ten states (III).
A complete residential system has five parts, as the Lightning Protection Institute lists them: strike termination devices, conductors, grounding electrodes, bonding, and surge protection (LPI). The risk method above gives a sense of scale. A 50 ft × 40 ft house with a 25 ft ridge on an open lot has a collection area of about 3,080 m². At a North Texas density of about 7, that’s roughly one direct strike every 46 years. At a far West Texas density of about 3, it’s roughly one every 108 years.
See our residential lightning protection page.
What it means for commercial buildings
Commercial buildings are bigger and usually taller, so they collect more strikes, and a strike costs more when it takes down a business. In the US, systems are designed to NFPA 780 or UL 96A, and the International Building Code (2024, section 2703.2) points to both (UL Solutions). Building codes are adopted city by city in Texas, so check with your local building department which edition applies.
If an insurer, tenant or specification asks for a certified system, the usual document is a UL Master Label certificate. It’s valid for five years and lapses early if the roof, the structure or the system changes (UL Solutions). Our commercial lightning protection page covers warehouses, offices and industrial buildings.
What it means for tank batteries and oil and gas sites
Lightning is a well-documented ignition source at production sites. A University of North Dakota review for that state’s Industrial Commission cites a study of 242 tank accidents over 40 years in which lightning was the most frequent cause, at 33% (EERC). The same review found that most oil and gas states don’t require lightning protection at production sites, so the decision usually sits with company policy.
NFPA 780 added a section on tank batteries (7.8) in the 2023 edition. It covers ground-level potential equalization and the control of flammable vapor where a strike or arcing is likely (NFPA 780). For Permian sites, the priorities are:
- Bonding tanks, piping, separators and heater-treaters into one grounding system
- At least two ground connections on each steel tank, tested and documented
- Attention to fiberglass produced-water tanks, which can’t carry current across their shell
- Inspection after storms and after any equipment change
Our articles on tank battery lightning protection and floating roof tanks go into detail. The oil and gas lightning protection page covers the services side.
Before the next season
Use our free lightning risk assessment checklist to work through a building or site before spring. For definitions of the terms used above, see lightning protection terms, explained.
Talk to us about your Texas property
Site Safe Lightning Protection provides lightning protection systems and inspections for homes, commercial buildings and oil and gas facilities. See lightning protection in Texas for what we do across the state. To check coverage for your part of Texas and talk through your property, contact Site Safe Lightning Protection.
Talk to Site Safe Lightning Protection about your property.
Frequently asked questions
When is lightning season in Texas?
Lightning can strike in any month, but summer is the peak. NOAA's National Severe Storms Laboratory found the highest cloud-to-ground density in Texas in summer, followed by spring. North Texas gets a strong spring season from March through May, and Texas still sees lightning in October and November after most of the country has gone quiet.
Which state has the most lightning?
Texas has the most in total. Vaisala counted 47 million lightning events in Texas in 2025, more than any other state. Adjusted for area, Florida and Oklahoma lead for density.
Where in Texas gets the most lightning?
The upper Texas coast around Houston has the highest annual flash density on NOAA's 1995 to 2019 Texas maps, followed by East and North Central Texas. Far West Texas gets the least.
How much lightning does Dallas-Fort Worth get?
AEM's detection network recorded 17,754 lightning flashes at Dallas-Fort Worth International Airport in 2025, with 1,410 on August 4 alone. That put DFW in the top five of the ten busiest US airports for lightning.
Do oil and gas sites in the Permian Basin need lightning protection?
Usually it's a company decision. A University of North Dakota review found that most oil and gas states don't require lightning protection at production sites. The same review cites a study of 242 tank accidents in which lightning was the most frequent cause. See our tank battery article for what NFPA 780 and API RP 545 cover.
Sources
- Vaisala Xweather Annual Lightning Report 2025: U.S. lightning hits eight-year high (Vaisala, January 2026)
- 2025 United States Lightning Report (AEM / Earth Networks)
- Annual and Monthly Distributions of Cloud-to-Ground Lightning in Texas, 1995-2019 (K. Calhoun, NOAA NSSL/CIMMS, via SCIPP)
- Monthly Distributions of U.S. NLDN Cloud-to-Ground Lightning (R. Holle and K. Cummins, Vaisala)
- Colorado Lightning Statistics as Compared to Other States (NWS Pueblo)
- Facts + Statistics: Lightning (Insurance Information Institute)
- Lightning Protection Overview (Lightning Protection Institute)
- NFPA 780, Standard for the Installation of Lightning Protection Systems, 2023 edition (NFPA document page, free read-only access)
- UL Solutions: Lightning Protection Installer and Master Label Certificate Program
- Lightning Protection Scoping Study, final report (UND Energy & Environmental Research Center, revised May 2020)